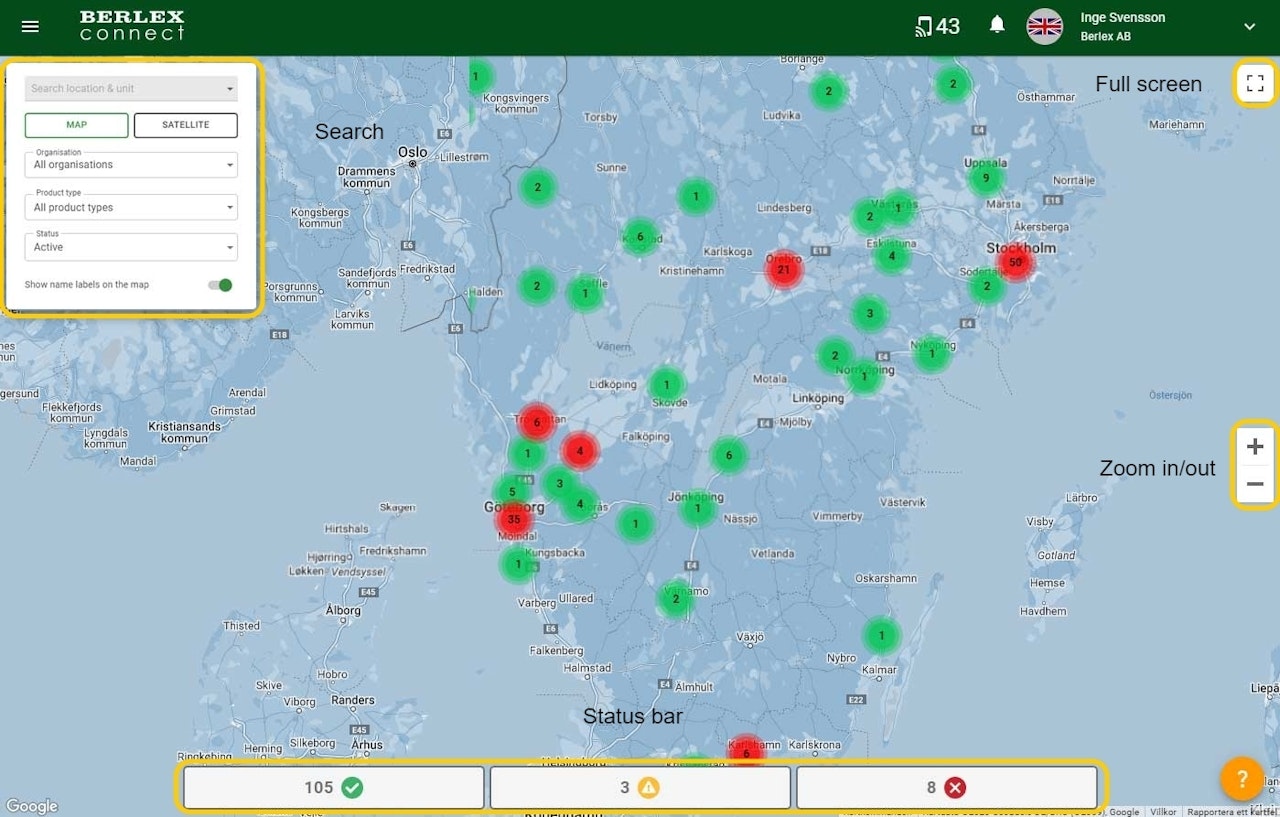

Map and status bar
When the window is opened, it is automatically zoomed out so that you can clearly see all devices in active systems. By clicking on a device, you can easily access that device's settings.
At the bottom of the window, a status line of saved systems is displayed. This status line consists of three fields, each of which describes the status of the systems that are active.
Green : contains systems that work without remark
Yellow: contains systems where one of the signals has sent out a warning, e.g. low voltage on the battery
Red: contains systems that have reported errors and gone into error mode
From this status line, one can proceed to settings of specific systems and devices. If you click on one of the three fields, these open up and show the systems they contain.
You can also search for a specific unit.
